K MEANS CLASSIFIER
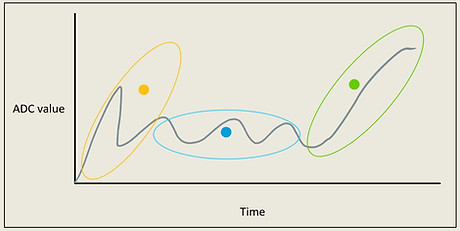
I completed this project while at my internship with Skip Scooters. The goal was to improve the firmware on the custom electric locking mechanism for the electric scooter in development. The image above shows a sample of the output data from the lock in three clusters as a result of the k means clustering algorithm I implemented. This pattern recognition algorithm was implemented to improve the locking and unlocking of this mechanism.
Locking Pin
DC motor

Worm Gear
Decklock
Lock To

Cable for Lock To
Shackle
To understand the need for this project, I must first explain how the lock itself works. The left image above shows the inside of the locking mechanism. The two locks that I worked on throughout this project are the Decklock and the Lock To. The Decklock is inside the deck of the electric scooter and is used to lock the removable battery inside the deck. The Lock To is on the stem of the electric scooter and used to lock the scooter to a bike rack. Both locks work in the same way; the only difference is that the Decklock is controlled by a separate circuit board while the Lock To is controlled by the main circuit board in the scooter.
The locks work by controlling a small DC motor that spins the worm gear. Once the worm gear hits the back of the locking pin, the locking pin is unable to move backwards, hence locking the lock. Unlocking the lock works the same way as locking but in reverse. A unique feature of this lock is its self-sensing capability. The locking mechanism will only lock if the shackle in the right image above is inserted into the Lock To. The same is true for the Decklock, the only difference being that instead of a cable connected to a shackle it is the deck of the scooter.
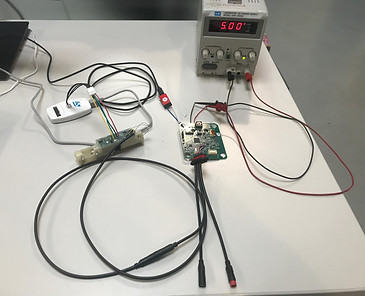

The DC motor outputs an Analog to Digital Converter (ADC) value that is used to control the motor in the firmware. In order to read the ADC value from the motor we used an FTDI chip to convert the UART signal coming from the lock to a USB signal for the PC. The testing set up is shown in the left image above. For these tests, I read the ADC value from the lock as it was locking and unlocking.
Once I got this data, I put it into a graph to understand the behavior of the system. The right image above roughly shows the output data from the locks. As I no longer have access to the data itself I drew up a rough graph of the pattern the data followed. As you can see there are three distinct groups: first as the worm gear begins to turn there is an initial spike in the ADC value, then the ADC value follows a sinusoidal pattern as the worm gear is turning in the lock housing, finally as the worm gear hits the back of the locking pin the ADC value linearly climbs until it reaches a plateau.
When I was originally handed this project the firmware was structured in a way that once the ADC value exceeded a certain threshold the motor would stop moving. This did not work for two main reasons: the first being that some motors in the locking modules would hit the threshold ADC value during the initial spike therefore leaving the lock unlocked, and the second being that some motors in the locking modules would never reach the threshold ADC value causing the motor to overheat and its gears to strip. To solve these issues, and for a more robust locking and unlocking system, I rewrote the firmware to include a time variable and a k means classifier.
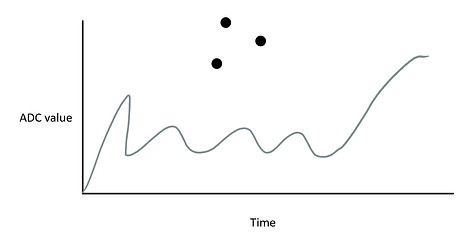
The k means clustering is a type of classification algorithm. The main idea is that it groups the data into k clusters, in my case three groups or clusters.The algorithm works by parsing through the given data and randomly generating three centroids or mean values as you can see in the left image above. Then the euclidean distance from each data point to each centroid is calculated using the following formula:
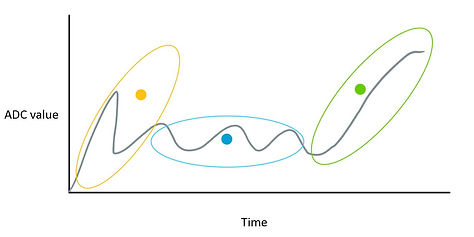
Here p1 is the time value of the data point, q1 is the time value of the centroid, p2 is the ADC value of the data point, and q2 is the ADC value of the centroid. The data points are then placed into clusters based on their euclidean distance to each of the centroids. For example, if the data point has the shortest euclidean distance to centroid1 when compared to the euclidean distance to centroid2 and centroid3, the data point will be placed in cluster1. Once all the data points are placed into these clusters, the mean of all the data points in each cluster is calculated to become the new centroid value. This process is then repeated until the old mean or centroid value is equal to the new mean or centroid value, as you can see in the right image above.
The main part of the algorithm was implemented in a python script using data that had been gathered for numerous locking systems. Once the final mean values were determined with the python script, they were hard coded in C in the firmware of the locks. When the locks would unlock or lock, the distance from the ADC and time values to the mean values would be calculated to determine which stage in the locking and unlocking process the lock was in. This firmware update was incredibly successful as it solved the two problems I mentioned above and it was used to define potential error cases for future locks.